

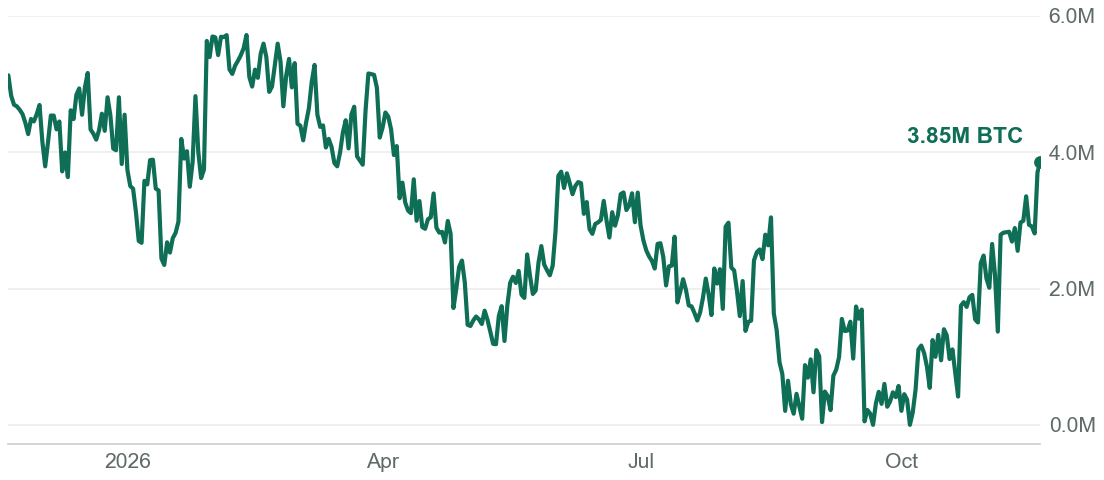
Coins held at a loss by recent buyers reached a 90-day high: 3.85 million BTC
Sent to subscribers on the morning of Friday, November 20, 2026, with figures to the close of Thursday, November 19, 2026, UTC.
That is 96.9% of the 3.97 million BTC held by short-term holders; 0.12 million BTC are in profit.
Bitcoin closed at $61,881 against their average cost of $73,505.
Bitcoin is now more than 50% below its record
It closed at $61,881, 50.4% below the record close of $124,824 on Oct 6, 2025.
The deepest point since that record was 53.1% below it, on Jun 30.
The Pi Cycle ratio climbed to 0.509, its highest since Dec 23, 2025
It compares the 111-day average of price with twice its 350-day average; the top signal fires at 1.0 and last fired on Apr 22, 2021.
A month ago it read 0.479.
Spot Bitcoin ETFs: a net outflow of $306.4M on Wednesday
Over the last five trading days the funds lost a net $1.01B; over 30 days, a net outflow of $3.31B.
Net flows since the funds launched in January 2024 add up to $54.15B.
In brief
- Bitcoin closed at $61,881, its lowest close in 90 days. Open BTC: Price
Where Bitcoin stands
| Price50.4% below the record close of $124,824 (Oct 6, 2025). | $61,881-1.6% on the day |
|---|---|
| Recent buyers' profit or loss (STH-MVRV)At a loss for 14 days; they paid $73,505 on average. | 0.8421.110 a month ago |
| Recent buyers' spending (STH-SOPR)Coins younger than 155 days are being spent at a loss. | 0.9887-day average |
| Spot ETF net flow-$3.31B over 30 days; $54.15B since the funds launched. | -$306.4MNov 18 |
| 50-day against 200-day averageThe 50-day average has been above the 200-day for 73 days. | +7.6% |
| Risk MetricIn the lower-middle of its 0 to 1 range since 2010. | 0.2590.385 a month ago |
| Pi Cycle TopThe top signal fires at 1.0; it last fired on Apr 22, 2021. | 0.5090.479 a month ago |
| Investor ToolPrice is 30.6% below its 2-year average of $89,128, the tool's lower line. | 0.69×price ÷ 2-year average |
Hyperliquid
| HYPE price31.4% below the record close of $97.14 (Sep 22). | $66.64-0.4% on the day |
|---|---|
| HYPE in bitcoin12.0% above its 200-day average. | 107,695 sats200-day average 96,114 |
| Perpetual fundingLongs are paying shorts: more demand to be long. | +4.7% a year30-day average +11.8% |
| HYPE futures volume14% below its 7-day average. | $589.2M7-day average $685.7M |
| USDC on HyperliquidNet deposits on the day. | $5.88B+$30.2M on the day |
New on Black Almanak
- HYPE: MACD: The gap between HYPE's fast and slow price averages, in dollars, and whether that gap is widening or closing.
- BTC: Hash Ribbon: The one-month and two-month averages of Bitcoin's hash rate: when the short one drops below the long one, miners are switching machines off.
Every sentence comes from fixed rules over the validated data behind the charts. Nothing here is investment advice.