

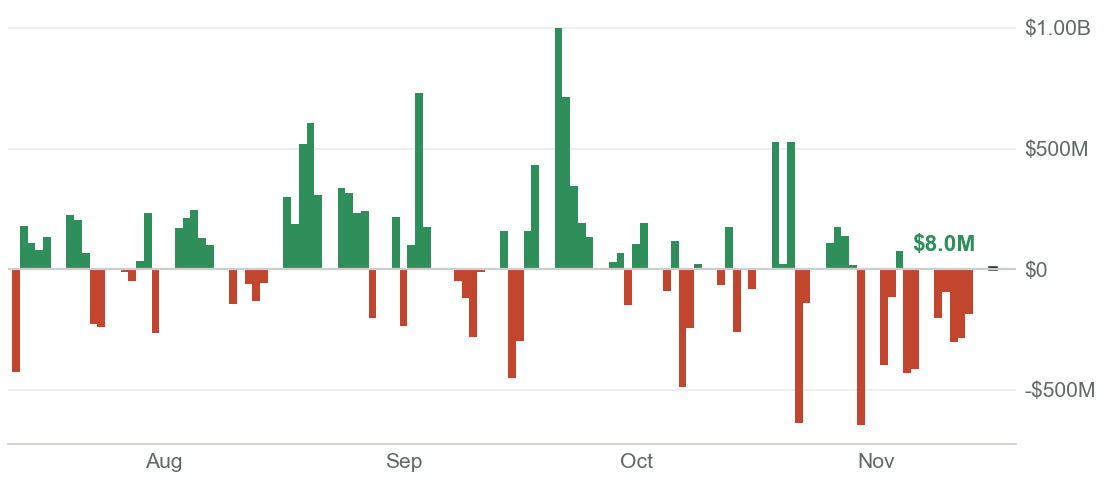
Spot Bitcoin ETFs returned to net inflows after 7 days: $8.0M on Monday
Sent to subscribers on the morning of Wednesday, November 18, 2026, with figures to the close of Tuesday, November 17, 2026, UTC.
Over the last five trading days the funds lost a net $856.4M; over 30 days, a net outflow of $2.24B.
Net flows since the funds launched in January 2024 add up to $54.69B.
Recent buyers have been at a loss for 12 days
Coins moved in the last 155 days cost $74,007 on average and are worth 12.3% less now.
Those spent lately went for less than they cost (7-day STH-SOPR 0.988).
HYPE perpetuals traded $507.1M on Tuesday, 20% below the week's average
Funding came to +10.1% a year: longs paid shorts to hold their positions.
Bitcoin at $64,908: 48.0% below its record close
Over 30 days the price is down 20.8%.
It sits 10.8% below its 200-day average of $72,792, and the 50-day average has been above the 200-day for 71 days.
Where Bitcoin stands
| Price48.0% below the record close of $124,824 (Oct 6, 2025). | $64,908-0.1% on the day |
|---|---|
| Recent buyers' profit or loss (STH-MVRV)At a loss for 12 days; they paid $74,007 on average. | 0.8771.100 a month ago |
| Recent buyers' spending (STH-SOPR)Coins younger than 155 days are being spent at a loss. | 0.9887-day average |
| Spot ETF net flow-$2.24B over 30 days; $54.69B since the funds launched. | $8.0MNov 16 |
| 50-day against 200-day averageThe 50-day average has been above the 200-day for 71 days. | +8.5% |
| Risk MetricIn the lower-middle of its 0 to 1 range since 2010. | 0.2810.379 a month ago |
| Pi Cycle TopThe top signal fires at 1.0; it last fired on Apr 22, 2021. | 0.5080.475 a month ago |
| Investor ToolPrice is 27.2% below its 2-year average of $89,207, the tool's lower line. | 0.73×price ÷ 2-year average |
Hyperliquid
| HYPE price28.1% below the record close of $97.14 (Sep 22). | $69.84-0.2% on the day |
|---|---|
| HYPE in bitcoin12.6% above its 200-day average. | 107,596 sats200-day average 95,570 |
| Perpetual fundingLongs are paying shorts: more demand to be long. | +10.1% a year30-day average +11.9% |
| HYPE futures volume20% below its 7-day average. | $507.1M7-day average $634.2M |
| USDC on HyperliquidNet withdrawals on the day. | $5.84B-$9.1M on the day |
New on Black Almanak
- BTC: Difficulty Ribbon: Eight moving averages of Bitcoin's mining difficulty, from 9 to 200 days: when they bunch up or cross, miners are under pressure.
- HYPE: Rolling Sortino Ratio: How much return HYPE has paid over the last 365 days for each unit of its falls, ignoring the swings upward.
Every sentence comes from fixed rules over the validated data behind the charts. Nothing here is investment advice.